
HC-108 : 原爆の被害状況を示すグラフ
| URI | https://dc.lib.hiroshima-u.ac.jp/nucl/metadata/7379 |
|---|---|
| ファイル |
7-HC-108.jpg
( 76.0 KB )
公開日
:2014-05-02
7-HC-108c.jpg
( 66.0 KB )
公開日
:2014-05-02
|
| 公開状態 |
学外公開
|
| コレクション |
AFIP写真ファイル
|
| タイトル |
HC-108 : 原爆の被害状況を示すグラフ
|
| タイトルヨミ |
HC-108 : ゲンバクノヒガイジョウキョウヲシメスグラフ
|
| タイトル別表記 |
Chart
|
| 内容記述 |
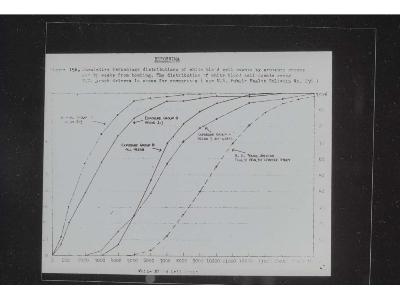
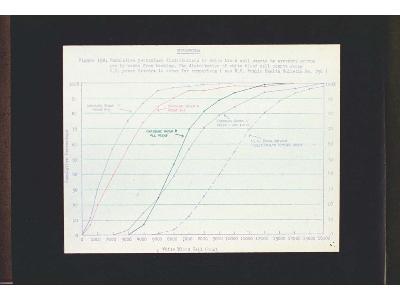
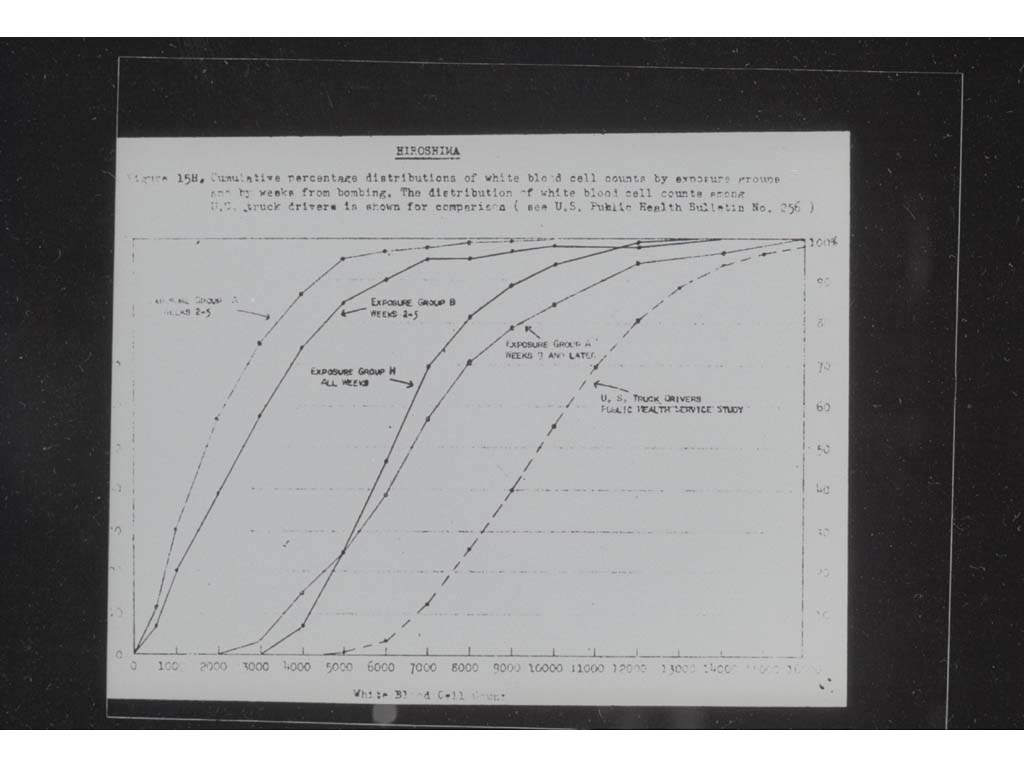
HIROSHIMA: Figure 15H. Cumulative percentage distributions of white blood cell counts by exposure groupe and by weaks from bombing. The distribution of white blood cell counts among U.S. truck drivers is shown for comparison (see U.S. Public Health Bulletin No. 256). |
| ファイル番号 |
HC-108
|
| ファイル区分 |
グラフ
|
| セット |
AFIP写真
|
| 本文言語 |
日本語
|
| 資料タイプ |
その他
|
(C) 2004-2005 広島大学原爆放射線医科学研究所・広島大学図書館